
This article covers the AlphaSense Financial Data you will find throughout the platform
- What’s Included in AlphaSense Financial Data Tools?
- Company Profile Financials & Metrics
- Screener Tools
- Industry Comps
- AlphaSense Data & Models Excel Add-In
- Canalyst Models
What’s Included in AlphaSense Financial Data Tools?
AlphaSense's financial data tools help investment professionals and corporate users analyze trends, benchmark performance, and make faster, more informed decisions.
Data is pulled directly from company reports, regulatory filings, and trusted market data providers. Tools include:
- Company Profile Financials & Metrics: surfaces a company's core financial data in one place, no need to pull separate reports or filings.
- Screener: Customizable targeting across equities, M&A transactions, and funding rounds.
- Industry Comps: Pre-built comparable company analyses across 115+ industries, with exportable comp tables for strategy or valuation slides.
- Excel Add-In: Live, formula-driven, refreshable AlphaSense data in Excel — statements, ratios, KPIs, and custom fields, in your own models or pre-built templates.
- Canalyst Models: 4,000+ pre-built, customizable financial models with segment detail and KPI drivers.
Company Profile Financials & Metrics
The Company Profile is your central hub for researching a single company, bringing together financial metrics, earnings commentary, documents, and AI-generated summaries in one place.
To open a Company Profile:
- Go to Generative Search.
- Type the company name in the search bar.
- Select the company from the auto-populated list.
Once on the Company Profile page, use the lefthand toolbar to open the Financial & Metrics section, where all financial data on the page lives.
The sections below cover what's in each section and how it supports your workflow:
- Financial Overview
- Valuation & Ratios
- Statements
- Comparables
- Charting
- M&A
- Pre-IPO Funding Rounds
- Shareholders
- Workforce Data
Financial Overview
The Financial Overview page provides a snapshot of a company’s historical, current, and projected valuation data, key metrics, and financial charts. You can toggle between annual and quarterly views and export tables to Excel for deeper analysis, including through the AlphaSense Excel Plug-in.
Valuation & Ratios
The Valuation & Ratios page offers interactive views of enterprise value multiples, leverage metrics, capital structure, and key financial ratios. It helps you assess financial health, benchmark performance trends, and evaluate profitability, efficiency, liquidity, and growth in one consolidated view.
Statements
The Statements section provides access to Income Statements, Balance Sheets, and Cash Flow Statements with up to 10 years of historical data and forward-looking broker consensus estimates. With annual and quarterly toggles and direct links to source filings, you can validate assumptions and analyze a company’s financial performance with confidence.
Comparables
The Comparables page delivers a side-by-side peer benchmarking view of valuation multiples, growth metrics, and sector KPIs. Customize peer sets , visualize metrics, and save watchlists to streamline analysis without relying on external spreadsheets. You can now star a comps set as a favorite to pin it to the top of your list. Your column and filter selections, including a new country filter, save automatically so you return to the exact view you left. You can also search for a peer by ticker and use Select All/Deselect All to build columns faster. An aggregate stats row now appears at the bottom of the table.
Charting
The Charting workspace allows you to turn financial line items or KPIs into customizable visualizations. Overlay multiple companies or metrics to quickly identify trends, inflection points, and outliers that may not be obvious in tabular data.
M&A
The Mergers & Acquisitions page helps you understand a company’s acquisition and divestiture activity by summarizing past transactions, target valuations, key performance metrics, and deal terms that inform strategic decision-making.
Pre-IPO Funding Rounds
The Pre IPO Funding Rounds view details financing events, including amounts raised, valuations, dates, and investors. It provides capital formation context for public companies and supports competitive intelligence and market trend analysis for private companies.
Shareholders
The Shareholders page integrates ownership and insider activity data directly into Company Profiles, providing visibility into institutional holdings (13F) and insider transactions (Form 4). It delivers a unified, searchable view that benchmarks ownership concentration, tracks changes over time, and surfaces signals to support diligence and competitive analysis. The new Latest View carries forward each holder’s most recently reported holdings for up to one quarter while new filings are pending. Users can still see the original filing period, without holdings disappearing between reporting cycles.
Workforce Data*
The Workforce page provides a centralized view of a company’s employee composition and workforce dynamics, including total headcount, growth, hiring, attrition, and average tenure, with breakdowns by job function such as Sales, R&D, and Customer Service.
*Currently available only on AlphaSense Company Profiles for private companies.
Screener Tools
The AlphaSense Screener filters and analyzes data across equities, M&A transactions, and funding announcements using 200+ filters — helping you identify opportunities, spot trends, and find potential competitors or acquisition targets.
To launch: select the Screener icon from the lefthand toolbar, then use the tabs at the top to switch between tools.
Screener Types Included in AlphaSense
| Screener Type | Explanation |
|---|---|
| Equity | Identify and filter public companies using 400+ quantitative and fundamental criteria across financial metrics, market data, sector, headquarters, market cap, and revenue. Save screens, export data, and create watch lists for ongoing monitoring. |
| Funding | Filter through 700k public and private companies and funding rounds based on quantitative and qualitative criteria like funding date, investors, amount raised, and post-money valuation. |
|
M&A *Deal Intelligence Agent |
Filter ~1 million M&A transactions by valuation multiples, industry, transaction size, buyers, and sellers, and more to quickly identify precedents and analyze market activity. |
*The M&A Screener also includes the Deal Intelligence Agent, which surfaces key transaction details and strategic rationale sourced from news, press releases, expert calls, and broker research.
Equity Screener
Identify lists of public companies and stock tickers matching defined metrics including industry, country, revenue, market capitalization, last close price, among many other metrics
After selecting the fields that you would like to add from “Manage Fields”, you can customize the filters from the column header. The Equity tab can then be leveraged to see what what public companies match your desired criteria.
You can also screen for M&A and Funding rounds, continue reading below to learn more.
Funding Screener
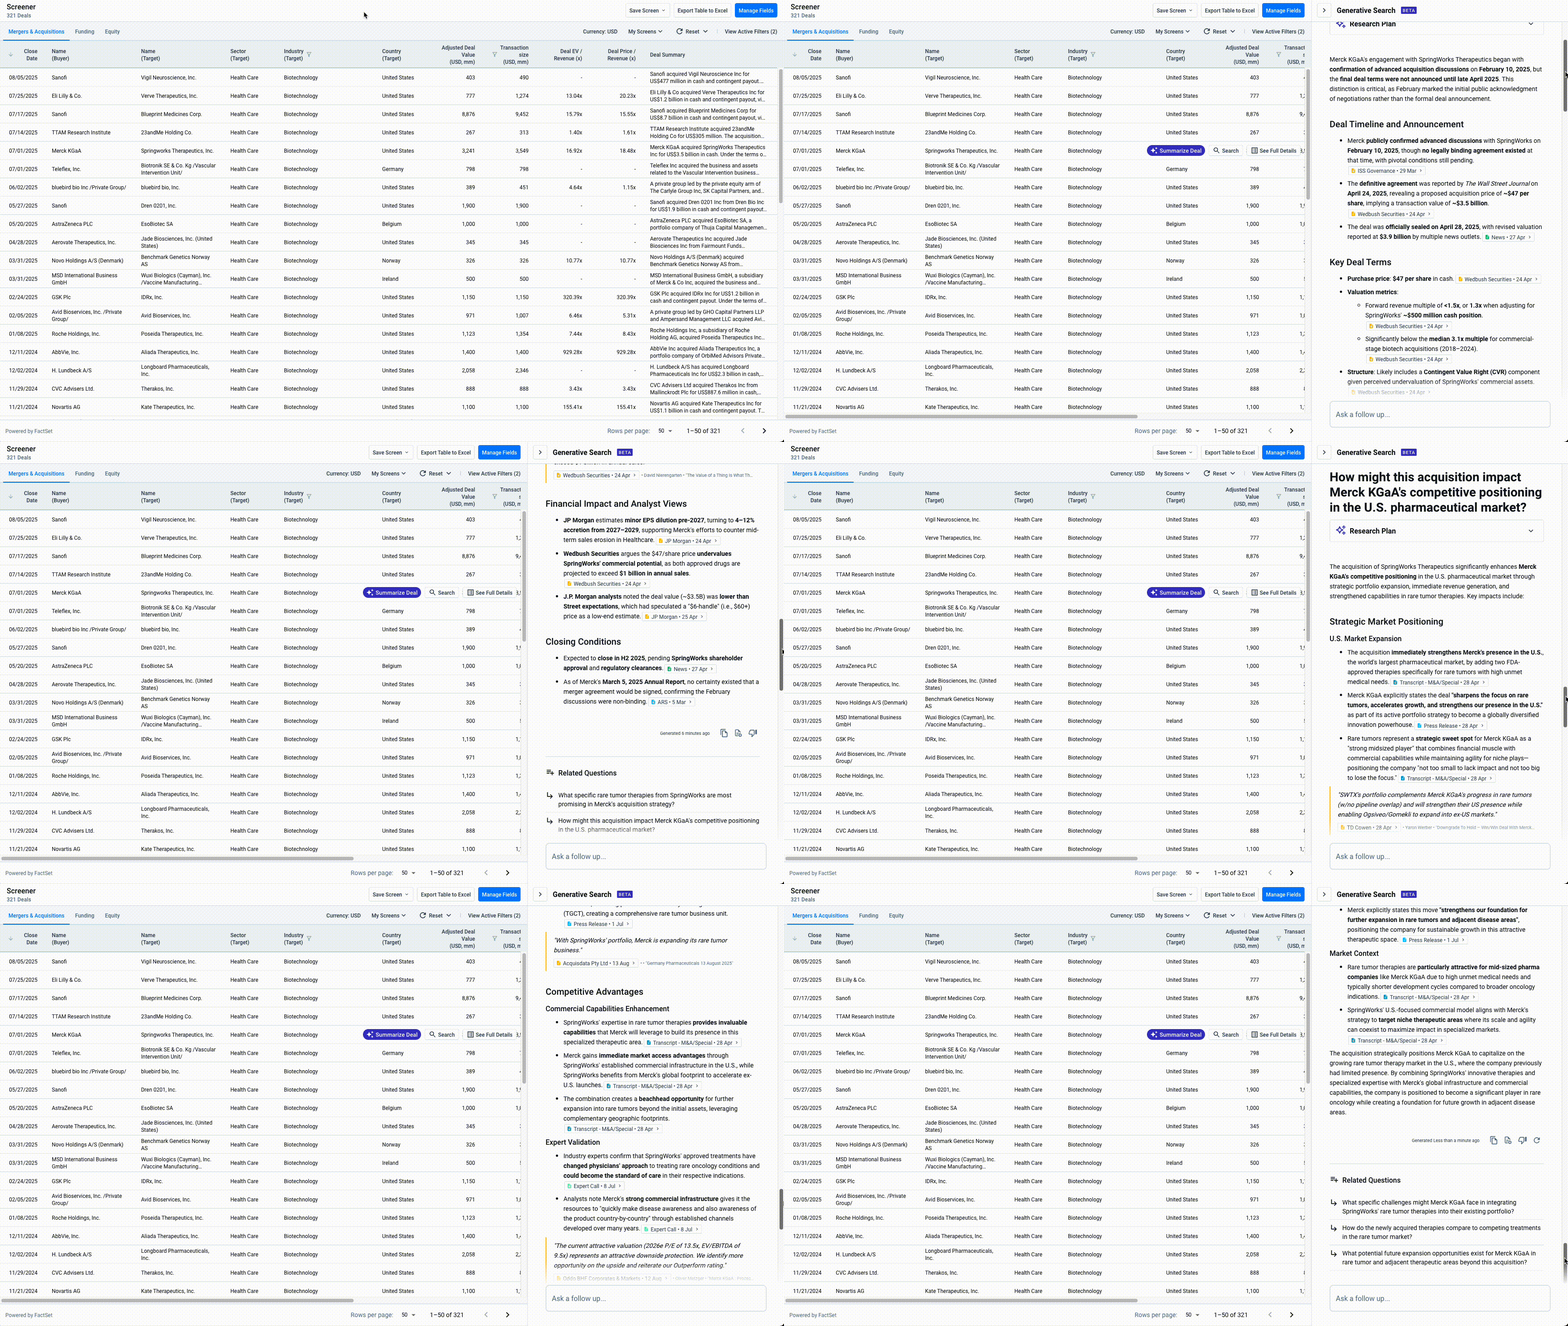
A funding round is any time money is raised from one or more investors for a business in exchange for equity or partial ownership.
Funding rounds like Series A, B, C, D, etc generally follow “seed funding” and “angel investing”. Funding raised at each round depends on the risk profile of the company as well as their maturity and company health metrics.
Funding round data enables you to look across private companies and startups for funding stages, types, announcement dates, and other metrics to analyze market trends, company growth trajectories, and more.
After selecting the fields that you would like to add from “Manage Fields”, you can customize the filters from the column header. The Funding tab can then be leveraged to see what companies and funding rounds match your desired criteria.
M&A Screener
Screen M&A deals that have been completed across a wide range of metrics including country, industry, announcement dates, deal descriptions, and more to view relevant precedents to inform your research.
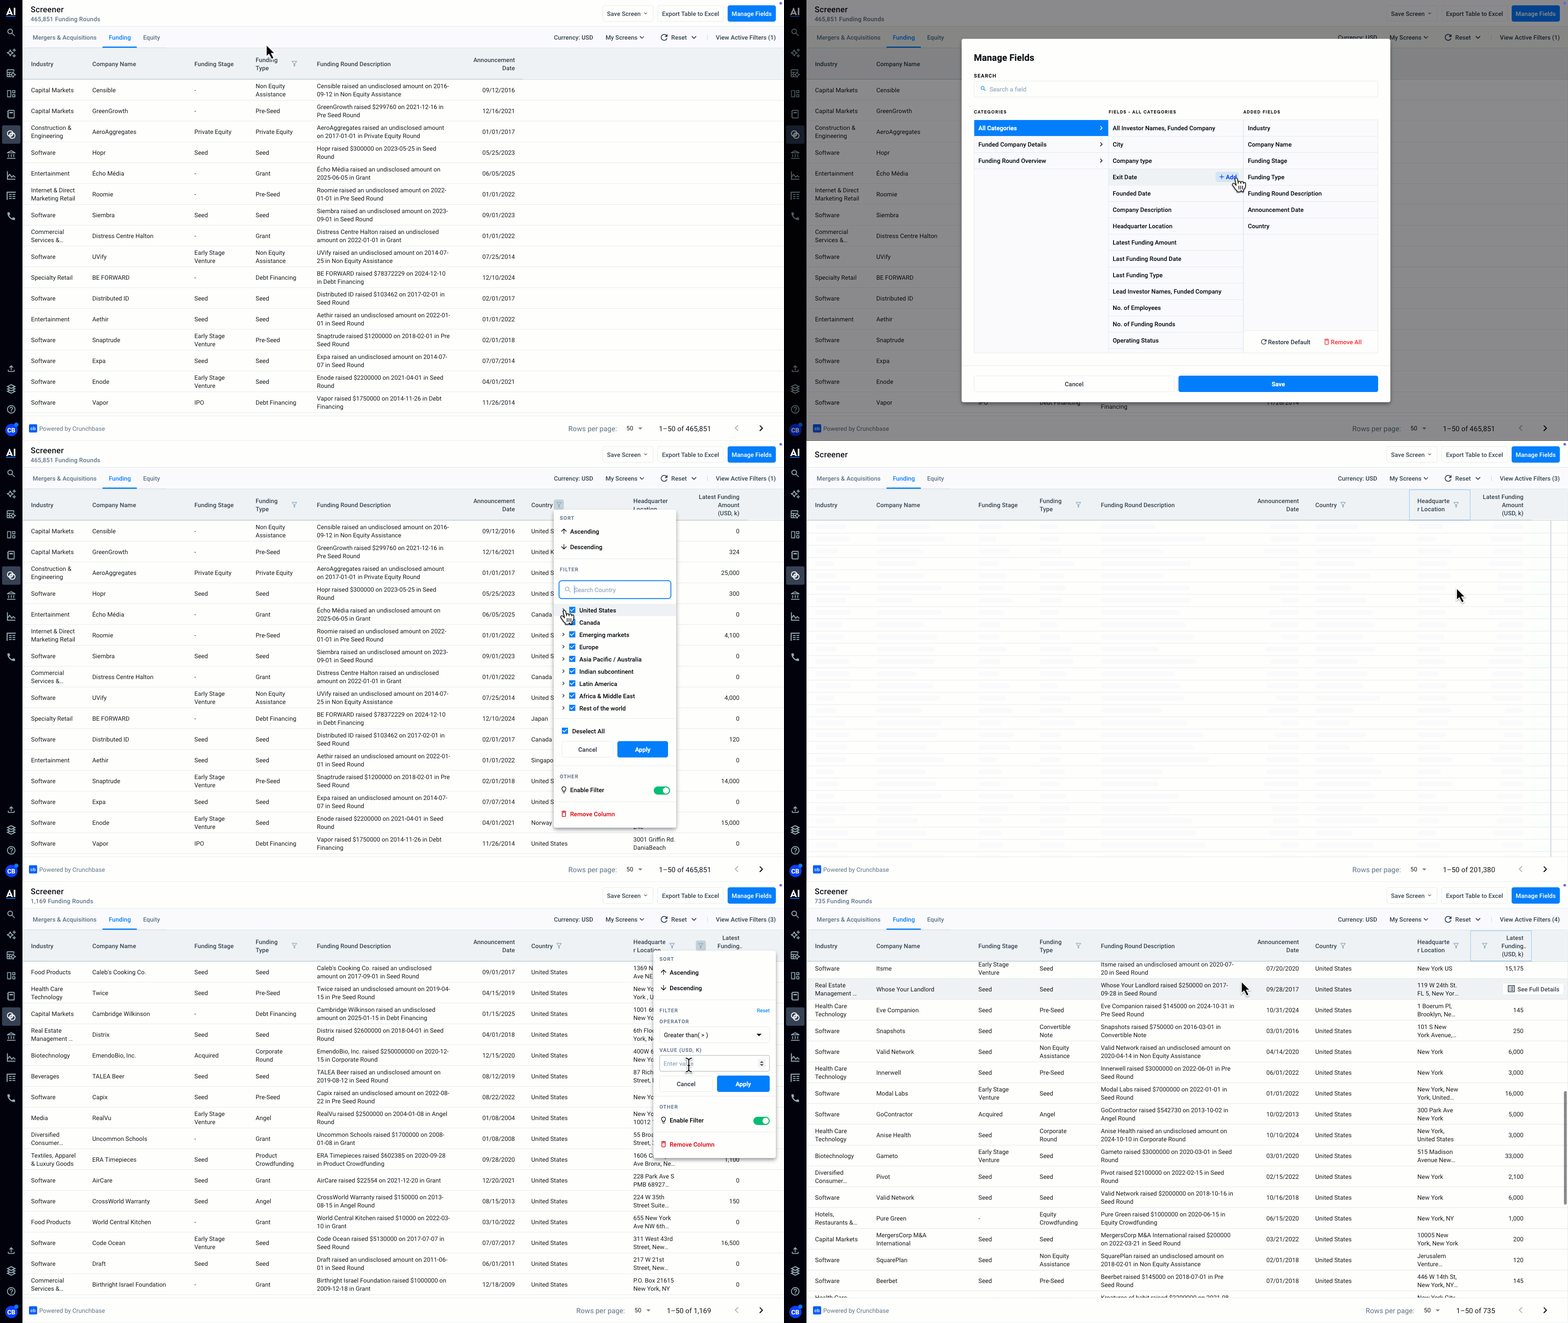
After selecting the fields that you would like added from Manage Fields, you can customize the filter from the column header. Next, you can add an active filter by selecting the column header. The Mergers and Acquisitions tab can then be leveraged to see what deals have transpired within your desired parameters.
When hovering over any deal that matches your filters, you will see a Summarize Deal button on the right hand side. Clicking this button activates the Deal Intelligence Agent that reveals strategic context, provides instant citations, and supports chat‑style follow‑up questions—without leaving your workflow. With Deal Intelligence Agent, you can instantly understand the story behind every deal and eliminate hours of manual research by surfacing key facts and strategy drivers in seconds.
Industry Comps
With Industry Comps, you get:
- Fast competitive benchmarking: Instantly compare performance across industry peers with 85+ pre-built comp sheets.
- Customizable insights: Tailor peer sets and metrics to specific goals — like benchmarking earnings performance or spotting growth opportunities.
- Expert-curated data: Sourced and curated by sector-focused analysts directly from filings, press releases, investor presentations, and supplementals.
- Efficiency boost: Save time with Excel exports and visualizations.
To access, select the Industry Comps icon from the lefthand toolbar.
Review this quick 4-minute demo to see how it works:
AlphaSense Data & Models Excel Add-In
With the native AlphaSense Data & Models Excel Add-In, you can pull live AlphaSense financials, KPIs, multiples, and custom fields straight into your spreadsheets using simple ASQ() formulas or the drag-and-drop query builder. You can refresh models with one click and jumpstart analysis with the template gallery.
With the AlphaSense Data & Models Excel Add-In you can:
- Keep your worksheets up to date with automated data refreshment to pull in the latest information.
- Build custom dashboards leveraging familiar Excel workflows.
- Save analysts hours otherwise spent manually collecting and aggregating data.
AlphaSense's Financial Data Excel Add-In can be downloaded in two ways:
Option 1 - Microsoft AppSource
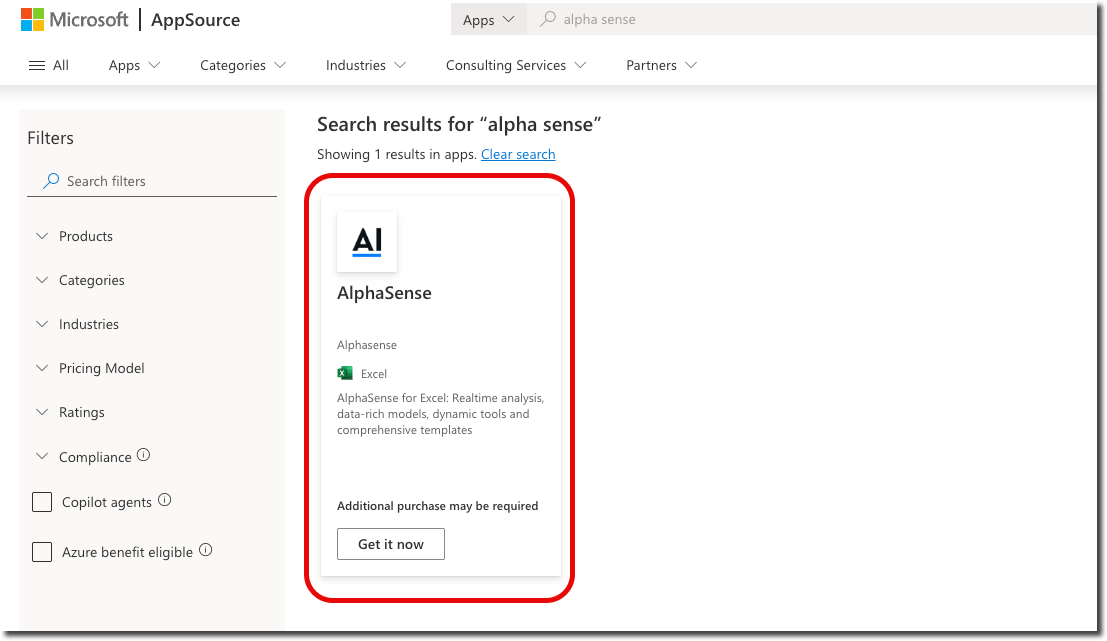
Follow this link to the AlphaSense App in Microsoft AppSource (or search for “AlphaSense” in the top search bar), select “Get it now” and follow on-screen instructions to download the Add-In.
- Step 1: Search for AlphaSense in the top search bar in Microsoft AppSource
- Step 2: Once you click, "Get it now" follow the on-screen instructions to download the add in.
Option 2 - Excel
Navigate to the “Home” tab and select the “Add-In” Icon. Then search for “AlphaSense'' in the left-hand search bar. Finally, select “Add” to download the Add-In. From here, AlphaSense will have its own tab in Excel.
Follow the breakdown below:
- Step 1: Navigate to the "Home" tab in Microsoft Excel
- Step 2: Click on the "Add-Ins" Icon
- Step 3: Search for "AlphaSense" and click on "Add" to download the app
Once it is successfully downloaded, you should see the AlphaSense tab and once you click My account you be prompted to sign into your AlphaSense account on the right-hand side of your screen.
Watch the demo below to get started:
Canalyst Models
Canalyst Models provide financial professionals with an extensive library of 4,000+ pre-built, highly accurate, and granular financial models that update automatically, saving time and enabling faster, more confident decision-making. With unmatched data accuracy and industry-specific KPIs, Canalyst models equip users with the detailed insights needed to streamline analysis, build scenarios, and outperform the competition.
These are no data sheets—they’re fully linked, driveable models with verified historicals and the most relevant data a company reports in filings, earnings presentations, supplementals, and press releases.
Watch this video walkthrough of one of our models to see it in action:
For more context surrounding Canalyst Models, check out this article.